How we developed our transport plan
We took the following key evidence into consideration whilst developing our plan.
Page contents
- Sustainability
- Geographical characteristics
- Carbon challenge
- Economy
- Communities
- Quality of life
- COVID-19 response
- Transport networks
- Future transport trends
Sustainability
An Integrated Sustainability Assessment (ISA) was undertaken alongside the development of the plan to ensure that the three dimensions of sustainability (environment, economy and society) are a guiding principle throughout. The ISA has helped us to carefully address any potential challenges that the plan presents, to ensure that they are avoided or dealt with. Read the Integrated Sustainability Assessment.
Geographical characteristics
Surrey covers 1,660 square kilometres. There are eleven districts and boroughs within the county and we share borders with several authorities, including Greater London. Nearly 1.2 million people live in Surrey (2018), making it one of England's most densely populated counties. 87% of the population live within urban areas, whilst over 70% of the county area is considered rural. Over 70% of Surrey falls within one or more national or international landscape or biodiversity designations, including:
- 2 Areas of Outstanding Natural Beauty (AONB) (Surrey Hills and Conservation; High Weald)
- Several special areas of conservation
- 65 Sites of Special Scientific Interest
- 3 Ramsar sites (wetlands of international importance)
- 2 Special Protection Areas
- 3 National Nature Reserves.
Carbon challenge
In 2020, we published a Climate Change Strategy which sets out Surrey's pathway to net zero carbon. It shows the carbon emissions reductions needed year on year for Surrey to achieve net zero and to limit cumulative emissions to make a fair contribution to the national and international carbon reductions necessary to avoid dangerous climate change.
Sustainable travel hierarchy
The sustainable travel hierarchy ranges from walking as the least polluting mode of transport at number 1 to air travel being the most polluting at number 7:
- walking
- cycling
- e-bikes
- public transport
- car clubs, taxis, car sharing
- private car
- air travel.
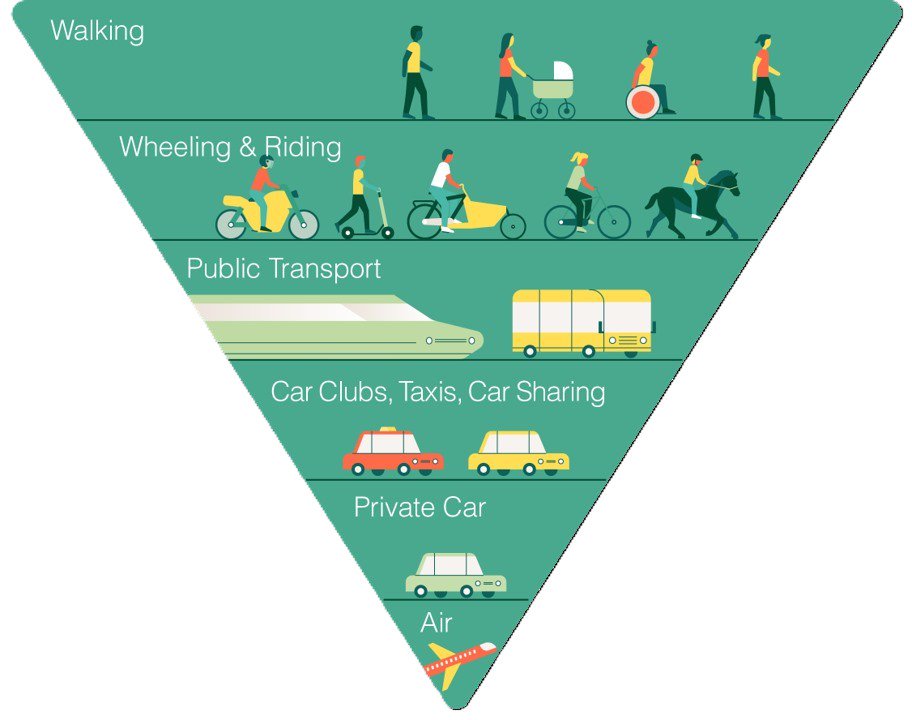
It is based on: Decarbonising Transport: Growing cycle use, Local Government Association, 2020.
Economy
Surrey has a very strong, productive and innovative economy, contributing over £40 billion per year to the national economy, through above average levels of output per hour worked. However, the pandemic highlights the risk of taking our economic success for granted. There are signs that Surrey's relative performance has been weakening. New businesses in Surrey have been created at a lower rate than the national average, suggesting that the county is becoming a less attractive place for companies.
Although Surrey's transport connections are a key strength, they also have limitations and constraints. For instance, east to west links in the county (other than the M25) are relatively weak. Before COVID-19, high traffic levels on Surrey's main roads led to unreliable journey times and congestion, that was estimated to cost businesses £550 million per year. These levels look set to return after COVID-19.
Rail services also experienced overloading before COVID-19. About 19% of Surrey's working population commuted into London, leading to significant crowding on peak services. It is not yet clear whether these levels of demand will return post COVID-19 due to the significant increase in home working.
Surrey also faces affordability challenges. It is the second most expensive county for housing nationally, making home-owning unaffordable for many essential workers. The quality of Surrey's environment accentuates this challenge as it limits the land available for new development.
Our Place Ambition 2050 strategy
Surrey's Place Ambition identifies eight Strategic Opportunity Areas, selected for their potential to support long-term sustainable growth:
- Longcross-Staines-Heathrow corridor
- Woking Hub
- Guildford Hub
- Blackwater Valley
- Cranleigh - Dunsfold corridor
- Epsom - Leatherhead corridor
- M23 - Gatwick corridor
- South Godstone.
These areas will provide the focus for investment to support priority industrial sectors and improvements to transport and digital connectivity within Surrey and to other strategic economic areas.
The LTP4's measures will also support the development of high-quality and attractive places to live and work, identified as an important element of sustainable growth in Surrey's Place Ambition. This includes producing guidance on Healthy Streets for Surrey, to deliver high quality, attractive, safe, accessible and sustainable development, that will contribute positively alongside other design elements to achieve a unique sense of place.
A key part of this will involve supporting good quality, sustainable access to town centres as the high street develops a 'new normal'. This is likely to include a mix of retail, leisure and commercial activities, residential units and services such as healthcare, supporting local communities and economic activity.
Communities
Surrey's population of nearly 1.2 million is forecast to grow significantly by 2041, including a 25% increase in those aged over 65.
Some groups have specific transport needs that need to be met; these groups may include those identified in the Health and Well-being Strategy as at risk of experiencing the worst health outcomes, as follows:
- Carers and young carers
- Children in care and care leavers
- Children with Special Educational Needs and disabilities
- Adults with learning disabilities and/or autism
- People with long term health conditions, disabilities or sensory impairment
- Older people 80+ & those in care homes
- Black and Minority Ethnic groups
- Gypsy Roma Traveller community
- Young people out of work
- People experiencing domestic abuse
- People with serious mental illness
- People with drug and alcohol problems
- People experiencing homelessness.
There are also priority groups in deprived areas of Surrey that need support. The majority of neighbourhoods in Surrey rank amongst the top 50% wealthiest in the country, of which several are in the top 10%. By comparison, the 17 most deprived neighbourhoods in Surrey in 2019 were in the top third in the country. Areas bordering London (Spelthorne), larger towns (Guildford and Epsom) and rural areas are significantly less wealthy than most of the county. Read more: Index of Multiple Deprivation 2019
Furthermore, food bank usage and homelessness have both increased in recent years. Foodbank usage across the county increased over 110% between 2013/14 and 2016/17, a far higher increase than other counties in the south east. In 2019, an estimated 23,000 children in Surrey were living in poverty. COVID-19 is likely to have worsened this situation.
There are 687,000 cars available to Surrey households, with nearly half (46%) of households having two or more cars. Only 13% of households have no car available. Of the districts, Surrey Heath has the highest car ownership levels in Surrey with 1.7 cars per household and only 10% with no car, while 56% have 2 or more. Epsom and Ewell have the lowest number of cars per household at 1.4 and the lowest proportion of households with 2 or more cars at 41%. However, car availability varies much more widely between areas within the districts.
The LTP4 will help to address the inequalities in Surrey's communities. It is aligned to our strategic objective to empower communities to tackle local issues and be actively involved in decision making concerning the future of our county. This will help to deliver Surrey's Community Vision for 2030, meaning that residents can reach their full potential and contribute to their community, ensuring that no one is left behind.
Quality of life
Health in Surrey
Surrey is generally a healthy county. The life expectancy and healthy life expectancy for those in the county is higher than south east regional and national averages. This is likely to be due to factors including the affluence of most areas of the county, positive early-years health indicators, low levels of smoking and high levels of physical activity.
Surrey 2030 Vision Evidence Base (PDF) states that:
- 70% of Surrey's adults are classed 'physically active' (150 plus minutes of activity per week), exceeding regional and national averages
- Only 18.6% of Surrey's adults are classed physically inactive (less than 30 minutes of activity per week) less than the regional and national averages.
- 17.3% of children in reception year in Surrey are overweight or obese, below the national average of 23%
Additionally, 25.3% of people in Surrey live within 500 metres of an accessible woodland area, compared to 16.8% in England.
Surrey also benefits from nearly 3,500 km of Public Rights of Way, mostly concentrated in rural areas. These take advantage of the physical landscape of the county, in locations across the AONBs of the Surrey Hills and High Weald. Access to green space and countryside is essential for both good physical and mental health, leading to an improved quality of life.
Air quality
Looking specifically at the health impacts of transport, road transport is the main source of Nitrogen Oxide (NOx) emissions and a significant source of emissions of solid and liquid particles in the air. Both of these pollutants have a significant negative impact on people's health, for example respiratory illness, childhood asthma and premature death from related conditions.
On average, Surrey's air quality is better than the national average, with an index of accessibility to air quality score of 26.1 compared to 26.8 nationally. However, there are 27 Air Quality Management Areas identified across Surrey and particulate emissions were estimated to account for 5.7% of mortality in Surrey in 2018. North Surrey's air quality is significantly worse than south Surrey's with index scores ranging from 46.9 in Spelthorne to 12.8 in Waverley, compared to the county average of 26.1.
Road transport also contributes to the 380 Noise Important Areas (areas where people are most affected by transport noise) identified throughout the county, and the associated negative impacts on the health and wellbeing of Surrey's people.
This transport plan will encourage and facilitate a reduction in road vehicle use, an increase in zero emissions vehicle use and an increase in healthier forms of travel such as walking and cycling. Combined, these behaviour and technology changes will help to significantly improve air quality, along with physical and mental health across our county. Read more about Air quality in Surrey.
COVID-19 response
The COVID-19 pandemic has had significant impacts on travel patterns. Across Surrey, as in the rest of the country, there was a dramatic decrease in travel volumes during the first lockdown in March 2020. Traffic showed a 68% decrease compared to March 2019. Through several stages, traffic levels had returned to largely equivalent to pre-pandemic levels by February 2021.
However, public transport use has only partly recovered since the first lockdown. Google mobility data suggests that activity in and around bus and rail stations remained more than 45% lower than pre COVID-19 levels in April 2021.
As we emerge from COVID-19 restrictions, there is uncertainty regarding future travel trends. Long term impacts may include:
- Fewer commuting and business trips due to increased levels of remote working;
- More flexible working hours that allow people to avoid rush hour traffic;
- A reluctance to return to public transport
- Increased levels of walking and cycling in local areas.
Many Surrey residents, responding to a county council survey in November 2020, identified an increased appreciation of walking and cycling in their local area and green spaces as one of the positive outcomes of periods of lockdowns. Nearly half expected to continue to walk and/or cycle more often in future. If we are able to build on these changes, this will help to address the challenges presented by the climate emergency and bring wider benefits of improved local environments and quality of life for Surrey's people.
Consideration of the impacts of COVID-19 and the rapidly altering economic and social landscape, has played an important role in developing the LTP4. For instance, a key consideration has been ensuring resilience is built into Surrey's transport network to help cope with the effects of factors like COVID-19 in the future, to enable effective, sustainable, and safe travel for all.
Transport networks
Due to Surrey's location, our transport networks are important both regionally and nationally. The proximity to London, the major airports of Heathrow and Gatwick, and connections from the ports of Portsmouth and Southampton mean that Surrey's infrastructure is a key part of both national and international transport links. There are several nationally important roads in Surrey, such as the M25, M23, M3, and A3. However, the road network is not without its issues as there are high congestion levels across the county and Surrey's roads carry over 60% more than the national average amount of traffic.
Average annual daily traffic for locally managed roads
(Excluding motorways and trunk roads)
- Surrey: 4,193 vehicles
- South East: 3,357 vehicles (20% lower than Surrey)
- England: 3,112 vehicles (28% lower than Surrey)
Average annual daily traffic for all roads
(Including motorways and trunk roads)
- Surrey: 7,225 vehicles
- South East: 5225 vehicles (27% lower than Surrey)
- England: 4,440 vehicles (38.5% lower than Surrey)
Before COVID-19, around 60% of Surrey's working population commuted, many for a distance of less than 10 kilometres, contributing to this congestion. The 2011 Census shows that of the working age population (people aged 16 to 74):
- over 60% travelled to work by car or van
- 17% used public transport
- 11% walked or cycled.
Additionally, despite an increased take up of walking and cycling, Surrey's residents walk and cycle to work less than the national or regional averages, with 10.8% of working adults walking and cycling to work compared with 13.7% nationally and 13.9% regionally. By borough proportions, travelling to work by walking or cycling vary between Guildford with 14.6% and Tandridge with just 7.8%.
Public transport services in Surrey connect populated areas and towns well, although more rural areas experience poor connectivity and a low frequency of bus services. In terms of the rail network, there are 84 railway stations in the county. Many are on routes that connect north east Surrey to the main London termini of London Waterloo, London Victoria, and London Bridge, as well as down to the south coast at Brighton and Portsmouth. Due to high volumes of London commuting, pre-COVID-19 levels of use caused issues with capacity at peak times.
Regarding road safety, Surrey has been reasonably successful in reducing casualties on the road network in recent years but there is more to do. Road safety, speeding, and anti-social driving remain a prime concern of Surrey's residents. The reported casualty rate per billion vehicle miles has been decreasing since 2009, with a decrease of around 280 for England, 200 for the South East and 250 for Surrey.
Future transport trends
Demand for travel is currently closely linked to population growth. The UK's population is forecast to grow by four million by 2030 to a total of 70.4 million. This is likely to add further pressure on existing transport systems. London is expected to account for 22% of this increase with the south-east region accounting for 18%. The government has set a target of nearly 7,000 new houses per year in Surrey over the next 10 years (about twice the previous delivery rates). Car ownership in Surrey is 86% compared to the national average of 73% and continues to rise. Congestion on the motorways and 'A' roads in Surrey is a major economic, social and environmental issue, which is likely to increase with projected population growth.
Surrey's transport network will need to accommodate the county's growth, alongside the rapid rates of growth anticipated in London and other neighbouring communities such as Aldershot. In addition to this, the travel demand for the over 70s age group is set to increase with a trend towards a more active retirement, and as the older population is expected to rise from 13% in 2016 to 17% by 2031. For rural areas especially, this means greater use of the private car.
Electric Vehicle uptake has increased in the UK from 2,254 new registrations in 2012 to almost 110,000 in 2020.
Surrey has a high amount of Electric Vehicle (EV) uptake based on several factors including wealth, levels of second car ownership, and commuting distance. Surrey's road network will need to be ready to accommodate these vehicles, as numbers increase, although there remains considerable uncertainty around how the technology will develop and how it will fit in with existing infrastructure and digital connectivity. There is a relatively high concentration of charge points in Surrey with over 200 charge points in 60 locations. This is set to increase significantly going forward. Read more about Electric vehicles in Surrey.
There is evidence that remote working has been increasing over the last decade with the amount of business space falling since 2008. Once the longer-term implications of changes during COVID-19 are felt, it is expected that remote working will have increased even further.
Policy and strategy review summary
A review of numerous relevant national, sub-national and local policies and strategies, has identified some clear themes for this LTP4:
- Setting a clear transport carbon pathway towards net zero carbon emissions by 2050 (and intermediate 60% reduction by 2035) to achieve Surrey's transport commitments set out in our Climate Change Strategy;
- Providing an overarching roadmap to set out how transport can support achievement of other policies including Surrey's Community Vision for 2030 and Surrey's Health and Wellbeing Strategy (currently being updated);
- Aligning the LTP4 to Surrey's Place Ambition in recognition that better planning of land use, planning for places and local communities is an essential tool in achieving the LTP4 objectives, particularly the shift in transport trends required to achieve net zero carbon emissions by 2050.
- Learning from the COVID-19 pandemic and the challenges and opportunities this brings for the LTP4.
LTP4 challenges
We have identified four key challenges to which this LTP4 must respond to achieve our ambitions for Surrey:
- An urgent need for action to respond to the climate emergency and meet the county council's commitment to net zero carbon in 2050 (see pathway to zero emissions by 2050 below);
- An aspiration to achieve sustainable growth in line with population projections and local policy ambitions;
- A responsibility to address areas of inequality in social mobility and pockets of deprivation experienced across the county; and
- An ambition to further improve health, wellbeing, air quality and quality of life for residents.
Pathway to zero emissions by 2050
We are committed to delivering on our net zero carbon ambition by 2050 and to achieve this we must reduce our Green House Gas emissions against 2019 levels by:
- 46% by 2025
- 67% by 2030
- 80% by 2035
- 87% by 2040
- 92% by 2045
- 100% by 2050
Read more in our Climate Change Strategy 2020. Our policy areas set out how we will achieve these ambitions.
Table 1.1: LTP4 Key challenges to address
Challenge | Drivers |
|---|---|
An urgent need for action to respond to the Climate Emergency and meet the county council's commitment to net zero carbon in 2050 | As defined in the 2019 Climate Emergency Declaration. Climate Change Strategy:
Community Vision for 2030: "Residents live in clean, safe, and green communities, where people and organisations embrace their environmental responsibilities". |
An aspiration to achieve sustainable growth in line with population projections and local policy ambitions | Community Vision for 2030, and associated evidence base:
Surrey Place Ambition objectives include:
|
A responsibility to address areas of inequality in social mobility and pockets of deprivation experienced across the county | Community Vision for 2030, and associated evidence base Vision that by 2030:
Current challenges:
Health and Wellbeing Strategy Objective:
Current challenge:
|
An ambition to further improve health, wellbeing, air quality and quality of life for residents | Community Vision for 2030 Everyone lives healthy, active, and fulfilling lives, and makes good choices about their wellbeing. Health and Wellbeing Strategy Represents collaborative working to:
Surrey Infrastructure Plan, Baseline Report Forecasts an increase in the dependency ratio (the balance between those who don't work and those who do) in Surrey from 64% to 80% by 2041. Climate Change Strategy Priorities for climate change will also bring about significant improvements in air quality and health of residents. Low Emissions Transport Strategy Surrey had 24 declared AQMAs in 2018, all of which have been declared in relation to excessive NO2. This figure is now 27 AQMAs. |
Scope of LTP4
The main role of transport is to provide access to opportunities, services and activities such as working, shopping, and socialising. The LTP4 aims to improve Surrey's transport system to make it more accessible and to meet other objectives, but also recognises that accessibility can be improved through:
- place making: bringing activities and opportunities closer to people through land use planning; and
- digital connections: broadband and mobile connections to allow online accessibility.
This LTP4 includes measures to improve accessibility in all of these ways, accounting for rapid development in technologies and the opportunities that they provide for all forms of accessibility; this means that it is wider reaching than previous Surrey transport plans.