Summary
Soft sand
| 2020 Sales (million tonnes) and trend | Average (10 years) sales and trend | Average (3 years) sales and trend | LAA rate (million tonnes) | Reserve (million tonnes) | Landbank (years) | Allocations (years) | Capacity (million tonnes per annum) |
|---|---|---|---|---|---|---|---|
| 0.47 (Decrease) | 0.4 (No change) | 0.47 (Increase) | 0.4 | 5.97 | 14.9 | 6.8 | 1.8 |
Comments on soft sand: Sales are down on the 2019 figures. The current supply situation is good although focused in the east of the county. Supply will inevitably become tighter towards the end of the plan period. It is recommended the previous year's LAA rate remains in place
Sharp sand and gravel
| 2020 Sales (million tonnes) and trend | Average (10 years) sales and trend | Average (3 years) sales and trend | LAA rate (million tonnes) | Reserve (million tonnes) | Landbank (years) | Allocations (years) | Capacity (million tonnes per annum) |
|---|---|---|---|---|---|---|---|
| 0.26 (No change) | 0.34 (No change) | 0.33 (Decrease) | 0.5 | 1.93 | 3.8 | 13.5 | 0.9 |
Comments on sharp sand and gravel: Sales are level with the 2019 figures. There are notable supply constraints demonstrated in the landbank figure, and further sites are anticipated to come into production. It is recommended the previous year's LAA rate remains in place.
All sand and gravel
| 2020 Sales (million tonnes) and trend | Average (10 years) sales and trend | Average (3 years) sales and trend | LAA rate (million tonnes) | Reserve (million tonnes) | Landbank (years) | Allocations (years) | Capacity (million tonnes per annum) |
|---|---|---|---|---|---|---|---|
| 0.76 (Increase) | 0.71 (Decrease) | 0.78 (Decrease) | 0.9 | 7.9 | 8.7 | 20.2 | 2.7 |
Comments on All Sand and Gravel: Overall sales position is up, despite the 10 year and 3year average figure declining due to lower than usual sales in 2020 due to Covid-19 pandemic.
Crushed rock
| 2020 Sales (million tonnes) and trend | Average (10 years) sales and trend | Average (3 years) Sales and trend | LAA rate (million tonnes) | Reserve (million tonnes) | Landbank (years) | Allocations (years) | Capacity (million tonnes per annum) |
|---|---|---|---|---|---|---|---|
| Confidential | 0.0 (No change) | 0.0 (No change) | 0.0 | 0.0 | 0.0 | Not applicable | Confidential |
Comments on crushed rock: Only active site is Oxted chalk quarry. Data cannot be provided because of commercial confidentiality.
Recycled/secondary aggregates
| 2020 Sales (million tonnes) and trend | Average (10 years) sales and trend | Average (3 years) sales and trend | LAA rate (million tonnes) | Reserve (million tonnes) | Landbank (years) | Allocations (years) | Capacity (million tonnes per annum) |
|---|---|---|---|---|---|---|---|
| 0.6 (Decrease) | 0.79 (Increase) | 0.94 (Decrease) | 1.0 | Not applicable | Not applicable | Not applicable | 1.3 |
Comments on recycled/secondary aggregates: Sales are down on 2019 figures. Supply is from fixed sites. There is no data from mobile plant on construction/demolition sites. Sales were lower than usual in 2020 due to the Covid-19 pandemic. It is recommended the previous year's LAA rate remains in place.
Marine sand and gravel
| 2020 Sales (million tonnes) and trend | Average (10 years) sales and trend | Average (3 years) sales and trend | LAA rate (million tonnes) | Reserve (million tonnes) | Landbank (years) | Allocations (years) | Capacity (million tonnes per annum) |
|---|---|---|---|---|---|---|---|
| 0 | 0 | 0 | 0 | 0 | 0 | 0 | 0 |
Comments on marine sand and gravel: No direct imports to Surrey, indirect imports to Surrey via rail and road.
Rock imports by sea
| 2020 Sales (million tonnes) and trend | Average (10 years) sales and trend | Average (3 years) sales and trend | LAA rate (million tonnes) | Reserve (million tonnes) | Landbank (years) | Allocations (years) | Capacity (million tonnes per annum) |
|---|---|---|---|---|---|---|---|
| 0 | 0 | 0 | 0 | 0 | 0 | 0 | 0 |
Comments on rock imports by sea: No direct imports to Surrey, indirect imports to Surrey via rail and road.
Rail depot sales (sand and gravel)
| 2020 Sales (million tonnes) and trend | Average (10 years) sales and trend | Average (3 years) sales and trend | LAA Rate (million tonnes) | Reserve (million tonnes) | Landbank (years) | Allocations (years) | Capacity (million tonnes per annum) |
|---|---|---|---|---|---|---|---|
| Confidential | 0.1 | 0.1 | Not applicable | Not applicable | Not applicable | Not applicable | Confidential |
Comments on rail depot sales (sand and gravel): Only active rail depot is Woking. Data cannot be provided because of commercial confidentiality. Rail aggregate depots continue to be safeguarded and the supply of recycled aggregates encouraged through the allocation of fixed sites in the Surrey Minerals Plan (2011).
Rail depot sales (crushed rock)
| 2020 Sales (million tonnes) and trend | Average (10 year) sales and trend | Average (3 year) sales and trend | LAA rate (million tonnes) | Reserve (million tonnes) | Landbank (years) | Allocations (years | Capacity (million tonnes per annum) |
|---|---|---|---|---|---|---|---|
| Confidential | 0.1 | 0.2 | Not applicable | Not applicable | Not applicable | Not applicable | Confidential |
Comments on rail depot sales (crushed rock): Only active rail depot is Woking. Data cannot be provided because of commercial confidentiality. Rail aggregate depots continue to be safeguarded and the supply of recycled aggregates encouraged through the allocation of fixed sites in the Surrey Minerals Plan (2011).
Comments: All sales figures in millions of tonnes rounded to one decimal place. Landbanks indicate a need for sharp sand and gravel - to be addressed through the new Surrey Minerals and Waste Local Plan. Although the landbank suggests healthy reserves of soft sand, supply is expected to become tighter towards the end of the plan period. The potential capacity level for recycled/secondary aggregates is in line with recent sales data, before the Covid-19 pandemic. There are no known issues with supply/capacity at rail depots. The production of the new Surrey Minerals and Waste Local Plan commenced in 2021.
*Please note, the title of this LAA was changed on 30 January 2023, from LAA 2021 to LAA 2020, as a result of new guidance from The Department for Levelling Up, Housing and Communities for LAAs to be named according to the year of their data.
Executive summary
Sales of sand and gravel at 0.76 million tonnes per annum (mtpa) in 2020 are above the 10 year average of 0.71 million tonnes per annum (mtpa). The 10 year average continues to decline along with recent sales.
The Surrey Minerals Plan 2011 (SMP) provides sufficient capacity to enable production of sand and gravel at an average rate of 0.9 mtpa, and soft sand at an average rate of 0.5 million tonnes per annum (mtpa) during the period 2009-2026. This provision is significantly higher than average sales over the last 10 years.
As a result LAA rates of 0.5 million tonnes per annum (mtpa) for sharp sand and gravel and 0.4 million tonnes per annum (mtpa) for soft sand are used in this LAA for the purposes of assessing future supply.
The overall landbank of 8.7 years at the end of 2020 masks a significant imbalance between reserves of soft sand (14.9 years) and concreting aggregates (3.8 years).
Concreting aggregate resources are likely to be replenished in the short to medium term based on Surrey Minerals Plan preferred areas. However, in the longer term it will likely be difficult to maintain a 7 year landbank.
The permitted resource position for soft sand is more favourable with a landbank of 14.9 years. However no additional sites are identified in the Surrey Minerals Plan.
There are limited prospects of identifying suitable additional sites for primary land won aggregates beyond those already identified in the Surrey Minerals Plan due to Surrey's environmental constraints.
Surrey will therefore become increasingly reliant on recycled and secondary aggregates, imports of marine aggregates from wharves on the Thames estuary, imports of land-won sharp sand and gravel and, in the longer term, soft sand imports from other counties.
Sales of recycled and secondary aggregates have increased significantly over the last 12 years. The Surrey Minerals Plan target is for at least 0.9 million tonnes per annum (mtpa) by 2026, which the 2020 sales figure does not meet. However this is due to reduced sales due to the Covid-19 pandemic. A rate of 1.0 million tonnes per annum (mtpa) is considered to be a robust basis for assessing future supply capacity.
Seven rail depots both within and just outside of the county enable Surrey to import a plentiful supply of crushed rock and marine aggregates. This infrastructure will become even more important and this capacity will need to be secured and enhanced into the future.
It is therefore important to ensure the continued safeguarding of mineral infrastructure, including rail depot and recycling facilities, both inside and outside of Surrey.
The review of the Minerals Plan commenced in 2020. The new Minerals and Waste Local Plan will need to address the potential for new mineral sites, the need for adequate aggregate recycling capacity and the adequacy of rail depot infrastructure, in order to ensure Surrey maintains a sustainable supply of aggregate.
Introduction
- Background Information
- Aggregates in Surrey
- Policy, Landscape and Environmental Constraints
- Land-won Sand and Gravel
- Other relevant information
- Recycled and Secondary Aggregates
- Imports and Exports
Background information
A Local Aggregate Assessment (LAA) is an annual assessment of the demand for and supply of aggregates in a mineral planning authority's (MPA) area. This LAA for Surrey for the 2020 calendar year is prepared by the minerals planning authority in accordance with national policy and guidance (National Planning Policy Framework (NPPF) para 226 and National Planning Policy Guidance (NPPG) planning for aggregate minerals) and supplementary guidance adopted by the South East Aggregates Working Party (SEEAWP).
Aggregates in Surrey
Aggregate deposits in Surrey comprise of sharp sand and gravel (concreting aggregates) and soft sand. The coarse sharp sand and gravel is mainly found as flood plain and terrace deposits in the valleys of the main rivers. Sharp sand and gravel is currently supplied from two active sites in Surrey (see Annex 1).
Soft sand is located in the Folkestone Formation, which is exposed in a belt stretching across central Surrey from Limpsfield in the east to Farnham in the west. Soft sand is currently supplied from five active sites in Surrey (see Annex 1).
Policy, landscape and environmental constraints
Approximately three quarters of the land within Surrey is covered by Green Belt. The Surrey Hills Area of Natural Beauty (AONB) covers approximately 26% of the county. There are nine sites in Surrey which are designated for their interest at an international and/or European level and the county hosts 63 Sites of Special Scientific Interest (SSSIs). Ancient Woodland covers approximately 12,000 hectares of the county. The majority of Surrey is rural but there are significant urban areas located in the north of the county near the boundary with London and also large towns such as Guildford, Woking, Reigate/Redhill and Farnham.
Land-won sand and gravel
Past sales data:
As a starting point, forecasts of aggregate demand should be based on a rolling average of the past 10 years' sales data (National Planning Practice Guidance, Department for Communities and Local Government (DCLG), Updated 06 March 2014, Para 062).
Table 1: Sales of land-won primary aggregates in Surrey (million tonnes) for last 10 years.
| Sand type | 2011 | 2012 | 2013 | 2014 | 2015 | 2016 | 2017 | 2018 | 2019 | 2020 | 10 year average | 3 year average |
|---|---|---|---|---|---|---|---|---|---|---|---|---|
| Soft Sand | 0.35 | 0.37 | 0.43 | 0.57 | 0.49 | 0.41 | 0.39 | 0.44 | 0.49 | 0.47 | 0.4 | 0.47 |
| Sand and Gravel | 0.31 | 0.25 | 0.36 | 0.41 | 0.27 | 0.39 | 0.41 | 0.50 | 0.24 | 0.26 | 0.34 | 0.33 |
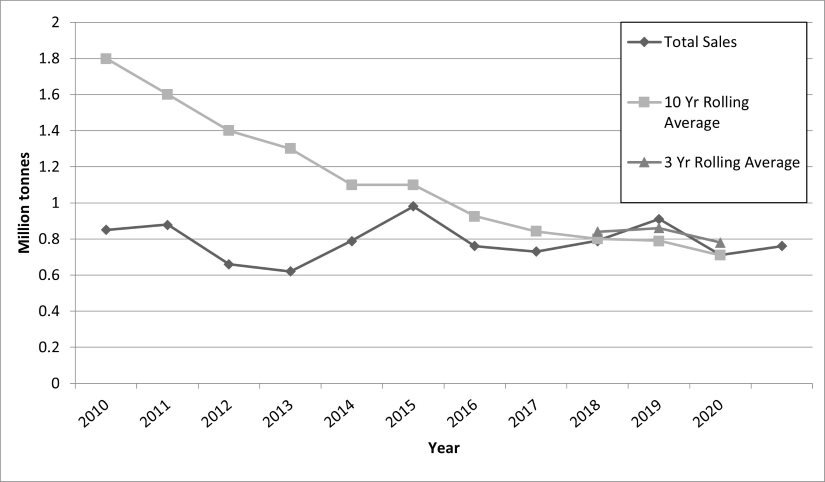
| Total | 0.66 | 0.62 | 0.79 | 0.98 | 0.76 | 0.73 | 0.80 | 0.91 | 0.71 | 0.76 | 0.71 | 0.78 |
Between 2011 and 2020, total sales have been below the current 10 year average of 0.79 million tonnes (with the exception of 2014, 2017 and 2018) due to the completion of mineral extraction at a number of quarries as well as the impact of the economic downturn between 2008 and 2013. In 2020 the sales figures increased, but are still lower than the peak sales reported in 2014 and 2018, due to the impact of the Covid-19 pandemic.
The current 10 year average of past sales of 0.71 million tonnes is well below the average minerals provision rate of 1.4 million tonnes per annum contained in the Surrey Minerals Plan. The 3 year average sales figure has fluctuated. Nevertheless, the general trend is that sales have increased since 2012.
Figure 1: Sales of land-won primary aggregates in Surrey with 10 year and 3 year rolling average trend lines
Other relevant local information
The National Infrastructure Delivery Plan 2016 to 2021 sets out the government's infrastructure plans for the next parliament and beyond. Projects in close proximity to Surrey, with forecast finish dates shown in brackets, include:
- Smart Motorways: M4 Junctions 3 to 12 commenced 2016/17 (2021/22);
- Rail: Crossrail under construction (2020);
- Airport Infrastructure Improvements at Heathrow Q6 under construction (2019) and Gatwick Q6 under construction (2020);
- Northern Line Extension (2020);
- Science and Research: Pirbright Institute Phase 2 under construction (2019).
Short term major infrastructure projects will rely on existing sources of supply. The more significant and longer term infrastructure schemes are likely to rely on imports of crushed rock and marine sand and gravel landed at wharves on the Thames Estuary. For example, the Marine Management Organisation (MMO) have stated that marine aggregate resources have supported a number of prestigious developments in the south east including Canary Wharf, the Channel Tunnel Rail Link, Heathrow Terminal 5, the 2012 London Olympics and the regeneration of the Thames Gateway (East Inshore and East Offshore Marine Plan, Areas, Evidence and Issues Report, 2012). This appears to reflect diminishing land won supplies in London and the South East.
The 2017 Surrey Infrastructure Study was produced on behalf of the Surrey local authorities to provide an up to date view of emerging development and infrastructure requirements to support growth across Surrey.
The 2017 Surrey Infrastructure Study identifies that:
- Surrey authorities are planning for growth over the 15 year period to 2031 delivering on average 4,357 dwellings per year. This compares with the historic 10 year average net completion rate of 2,791 dwellings.
- 65,356 dwellings are expected between 2016 and 2031, including new settlements, with an associated population increase of 9%.
Delivering the necessary infrastructure to support that growth from now to 2031 is estimated to cost at least £5.5 billion and will include projects such as:
- Redevelopment of Junction 10 Wisley Interchange;
- A3 and A320 corridor improvements
- 23 major transport schemes planned to tackle areas of significant congestion in town centres and to improve and modernise key road junctions;
- New schools
- Major Rail infrastructure improvements
New housing may be considered a useful proxy for overall aggregate demand. Clearly a significant uplift in housing construction is anticipated in Surrey up to 2031 and this could result in an average yearly completion rate of the order of 35% above that achieved during the previous decade (Surrey Infrastructure Study, 2017), but it is not clear whether this rate of construction will materialise and what impact it will have on aggregate demand. Housing completions have risen from approximately 2,400 in 14/15 to nearly 4000 in 2017/18, which is approaching the 4,357 dwellings per year anticipated by the Surrey Infrastructure Study. Aggregate sales have also risen during the same period - potentially of the order of 200,000 tonnes per annum. However, total sales remain historically low and well below the Surrey Minerals Plan provision rate.
Hence the situation will need to be monitored. Nevertheless, there is no evidence at present to suggest a major and sustained increase in aggregate demand from land won sources over and above the historic ten year sales levels.
Conclusion and local aggregate assessment rate
The current 10 year average of past sales (0.71 million tonnes per annum) covers periods of both economic growth and recession and is expected to be relatively consistent in the short to medium term, although the Covid-19 Pandemic may hamper sales slightly in the short term. As the economy begins to recover, some growth in demand for primary aggregates is anticipated, but this is not expected to give rise to average sales approaching the Surrey Minerals Plan provision rate of 1.4 million tonnes per annum. Indeed, sales are more likely to be closer to the current ten year average of 0.71 million tonnes per annum. It is also essential to husband the land won mineral resource and wherever possible to utilise alternative sources of aggregate in accordance with the National Planning Policy Framework, which states "Since minerals are a finite natural resource, and can only be worked where they are found, best use needs to be made of them to secure their long-term conservation. And so far as practicable, take account of the contribution that substitute or secondary and recycled materials and minerals waste would make to the supply of materials, before considering extraction of primary materials"(National Planning Policy Framework 2019 paragraphs 203 and 204 b).
Taking into account the potential growth factors, uncertainties and the national policy objective to make best use of minerals, an Local Aggregates Assessment rate of 0.9 million tonnes per annum (0.5 million tonnes per annum for sand and gravel and 0.4 for soft sand) is used to assess future supply options.
Recycled and secondary aggregates
The Surrey Minerals Plan Core Strategy Development Plan document set an ambitious target to supply at least 0.9 million tonnes by 2026. In order to help achieve this target, the Minerals Planning Authority adopted the Aggregates Recycling Joint Development Plan document in 2013 which allocates / identifies 11 sites for aggregates recycling.
The targets reflect the large quantity of construction, demolition and excavation waste managed in Surrey, a significant proportion of which is imported from London and surrounding counties.
Significant progress has been made with production of recycled aggregates in Surrey from 2007 to 2018 with yearly increases in sales, peaking at 1.15 million tonnes in 2017.
The 2020 sales figure of 0.6 million tonnes, is down on the previous year's sales and doesn't meet the 2026 target of 0.9 million tonnes per annum of recycled aggregate. The decrease in sales is largely due to the Covid-19 pandemic and the disruption this had to industry. Annual survey data only captures production from fixed sites, actual production figures will be higher given the volumes of recycled aggregates produced on construction and demolition sites using mobile plant.
Table 2: Recycled aggregates sales in Surrey 2008 - 2019 (million tonnes)
| Year | 2011 | 2012 | 2013 | 2014 | 2015 | 2016 | 2017 | 2018 | 2019 | 2020 |
|---|---|---|---|---|---|---|---|---|---|---|
| Actual Sales | 0.42 | 0.45 | 0.49 | 0.63 | 0.83 | 0.76 | 1.15 | 0.99 | 1.23 | 0.6 |
| Time period | 10 years | 3 years |
|---|---|---|
| Average Sales | 0.79 | 0.94 |
Conclusion and local aggregates assessment rate
The ten year average for recycled aggregate sales is 0.79 million tonnes per annum (mtpa). Given the steady growth in recycling over the last ten years, and the increasing reliance on recycled aggregate as a source of supply, it is considered more reasonable to base the Local Aggregates Assessment rate on the 3 year sales average, which is higher than the ten year average at 0.94 million tonnes per annum (mtpa). Looking forward, and acknowledging the increasing reliance on this supply option, a rate of 1.0 mtpa is considered a reasonable basis for assessing the supply of recycled aggregate capacity. This exceeds the longer-term target of 0.9 million tonnes per annum (mtpa) in the current Surrey Minerals Plan.
Imports and exports
Land-won sand and gravel
The 2019 Aggregate Minerals Survey indicates that Surrey imported 370,000 tonnes of land-won sand and gravel, primarily from the South Downs National Park and to a lesser extent from Hampshire, Buckinghamshire, Kent and West Sussex. Imports into Surrey are all understood to have been brought in by rail or road, either directly from quarries or from rail depots primarily located just outside the county boundary.
The demand for land-won imports is not anticipated to increase in the short to medium term. This is due to: (i) the significant increase in recorded sales of recycled aggregates; (ii) two current planning applications (one awaiting determination and one waiting to commence) for the combined extraction of 3.31 mt of sharp sand and gravel on preferred areas identified in the Surrey Minerals Plan Primary Aggregates Development Plan Document; and (iii) the potential for the remaining preferred areas to come forward.
However, in the next 10-20 years Surrey is likely to have run out of exploitable resources of sharp sand and gravel. A significant increase in the demand for imports can therefore be anticipated in the longer term. These may be imported from a wider catchment given that average haulage distances for aggregates have continued to grow, reaching 30 miles in 2016 (summary sustainable development data, sustainable development report, 2017, MPA).
Imports of marine aggregates
Marine aggregates make an important contribution towards the supply of construction aggregates across the UK, particularly in South East England, London and South Wales. In the South East of England, marine aggregates contribute as much sand and gravel as that from quarries, and supply one third of all primary aggregates. In London, 50% of all ready mix concrete contains marine aggregate (marine aggregates capability and portfolio, 2018).
The Aggregate Minerals Survey 2019 reports that 324,000 tonnes of marine-dredged sand and gravel was imported into the county, the majority of which originated from Greater London (east of). LAAs being produced by other South East MPAs suggest that the amount of provision being proposed for land-won sand and gravel is significantly lower than that previously apportioned in the Secretary of State's Proposed Changes to Policy M3 of the South East Plan (March 2010). This suggests there will be increasing demand for alternative sources of supply, including marine sand and gravel and recycled and secondary aggregates.
Imports of crushed rock
Surrey imported at least 450,000 tonnes of crushed rock in 2019, of which over 80% was imported from Somerset with the remainder primarily sourced from Leicestershire and Derbyshire (8%) and Glensanda Quarry, Scotland via the Isle of Grain (12%). A significant amount of crushed rock is imported directly into Surrey via the rail depot in Woking. The remainder is likely to have been transported to rail depots just beyond the county boundary and then transported the short distance into Surrey by road.
Future supply options
Land-won sand and gravel
Table 3: Permitted reserves of land-won sand and gravel in Surrey 2010-2020 ('000 tonnes)
| Year | 2010 | 2011 | 2012 | 2013 | 2014 | 2015 | 2016 | 2017 | 2018 | 2019 | 2020 |
|---|---|---|---|---|---|---|---|---|---|---|---|
| Concreting Aggregates | 2,454 | 1,865 | 1,923 | 1,750 | 1,488 | 3,432 | 3,294 | 3,195 | 2,731 | 1,994 | 1,934 |
| Soft Sand | 7,422 | 7,223 | 7,350 | 4,375 | 8,528 | 8,170 | 7,848 | 7,709 | 7,178 | 5,858 | 5,966 |
| Total Reserves | 9,876 | 9,088 | 9,373 | 6,125 | 10,016 | 11,601 | 11,142 | 10,914 | 9,909 | 7,853 | 7,900 |
Based on the Local Aggregates Assessment rate of 0.9 million tonnes per annum for sand and gravel, a permitted reserve of at least 6.3 million tonnes is required to maintain a landbank of at least 7 years. The remaining permitted reserves of 7.9 million tonnes at the end of 2020 are sufficient to maintain provision for over 7 years at the Local Aggregates Assessment rate of 0.9 million tonnes per annum.
The Surrey Mineral Plan identifies 11 preferred areas estimated to supply 15.42 million tonnes over the plan-period 2009 to 2026. At the end of December 2019, some 8.87 million tonnes of reserve identified in the Surrey Minerals Plan had yet to be granted planning permission, which indicates there is potential for a 7 year landbank to be maintained beyond 2023.
Table 4: New sand and gravel reserves (million tonnes) needed to maintain future landbank requirements based on new Local Aggregate Assessment rate of 0.9 million tonnes per annum
| Year | 2021 | 2022 | 2024 | 2026 |
|---|---|---|---|---|
| Reserves at start of year | 7.9 | 7 | 5.2 | 3.4 |
| Additional reserves to maintain 7 year landbank of 6.3 million tonnes | 0 | 0 | 1.8 | 3.6 |
The Development Plan document recognises the need to consider separate markets for concreting aggregate and soft sand. This stems from the fact that both demand and supply are distinct in terms of end use and geography of extraction. These distinct mineral types are analysed in more detail below.
Concreting aggregates
Based on the new LAA rate of 0.5 million tonnes per annum, the reserves are sufficient to maintain provision for 3 years.
The Surrey Minerals Plan Primary Aggregates Development Plan Document identifies 10 preferred areas for the extraction of concreting aggregate which contain an estimated combined resource of 12.72 million tonnes. There has been strong interest from industry in bringing forward some of these preferred areas, five of which have been granted planning permission in the period since the adoption of the current Minerals Plan 2011:
- Preferred Area F - Home Farm Quarry Extension, Shepperton (0.5 million tonnes);
- Preferred Area G – Homers Farm, Bedfont (0.75 million tonnes);
- Preferred Area J: Manor Farm, Laleham (1.5 million tonnes);
- Preferred Area K: Queen Mary Quarry, Ashford (1.25 million tonnes);
- Preferred Area L, Watersplash Farm, Halliford (1.17 million tonnes).
- A further application has been submitted for the production of 2.14 mt of concreting aggregates at a preferred area identified within the Surrey Minerals Plan. This is at Milton Park Farm (preferred area D).
A planning application has also been submitted for the extraction of approximately 3.2 million tonnes of sand and gravel at King George VI reservoir (Preferred Area H) following a public exhibition during summer 2019. The application (as of September 2021) has not been validated.
Table 5: New concreting aggregate reserves needed to maintain future landbank requirements based on new LAA rate of 0.5 million tonnes per annum
| Year | 2021 | 2022 | 2024 | 2026 |
|---|---|---|---|---|
| Reserves at start of year | 1.93 | 1.43 | 0.43 | -0.07 |
| Additional reserves to maintain 7 year landbank of 3.5 million tonnes | 1.57 | 2.07 | 3.07 | 3.57 |
Soft sand
The permitted resource position for soft sand is more favourable than for concreting aggregates, although the vast majority of the reserve is located in the east of the county. In August 2014, planning permission was granted for the extraction of 4.1 million tonnes of soft sand at Mercers South Quarry. In 2017 planning permission was granted for an extension to the permitted extraction area for a further 0.25 million tonnes of soft sand. This resulted in a significant increase in the soft sand landbank in the county. This is the only soft sand site allocated in the adopted Surrey Minerals Plan Primary Aggregates Development Plan document.
Planning permission for an extension of time was granted in October 2015 at Alton Road Farnham. This will enable the extraction of 770,000 tonnes of soft sand in the west of the county over a period of approximately 10 years. This adds an additional 1.5 years to the landbank for soft sand.
Using the LAA rate of 0.4 million tonnes per annum, the reserves are sufficient to maintain provision for 14.9 years. Soft sand production will therefore continue to meet demand until at least 2035. However, soft sand supply is likely to become a regional issue and it is important to ensure that there is not undue reliance on Surrey's reserves given the lack of identified additional sites and the significant environmental constraints on extraction on known resources which are largely within the Area of Outstanding Natural Beauty.
Table 6: New soft sand reserves needed to maintain future landbank requirements based on new LAA rate of 0.4 million tonnes per annum
| Year | 2021 | 2022 | 2024 | 2026 |
|---|---|---|---|---|
| Reserves at start of year | 5.97 | 5.57 | 4.77 | 3.97 |
| Additional reserves to maintain 7 year landbank of 2.8 million tonnes | Not applicable | Not applicable | Not applicable | Not applicable |
To inform the development of the current Surrey Minerals Plan the county council undertook a review of potential mineral zones (PMZs) across the county for both soft sand and sharp sand and gravel. In total 51 PMZs were identified as holding reserves of soft sand estimated at 193.26 million tonnes, of which some 5.63 million tonnes were allocated for extraction in the adopted Surrey Minerals Plan (See Table 1).
There remains a theoretical soft sand reserve of some 187.63 million tonnes in Surrey, distributed across the boroughs of Guildford and Waverley in the south west, and the districts of Mole Valley and Tandridge in the centre and east of the county. A small reserve of soft sand was also identified in the borough of Runnymede in north west Surrey.
Much of the remaining reserve of soft sand occurs within the existing boundaries of the Surrey Hills AONB. If extraction within the boundaries of the Surrey Hills Area of Outstanding Natural Beauty were to be ruled out the remaining reserve would reduce to some 28.03 million tonnes.
A review of the boundary of the Surrey Hills Area of Outstanding Natural Beauty commenced in 2021, which is expected to result in additional areas of land being covered by extensions to the existing boundary. Based on work undertaken for the county council in 2013, which identified areas suitable for inclusion within an extended Surrey Hills Area of Outstanding Natural Beauty, the soft sand reserves that would be found outside the extended Area of Outstanding Natural Beauty would reduce to some 17.83 million tonnes.
Recycled and secondary aggregates
Current capacity at recycled and secondary aggregates sites is over 1.5 million tonnes per annum (See Appendix 2). However, some 65% of this capacity is provided on sites with temporary planning permission. Hence, there is the likelihood of significant capacity loss over the next ten years. Table 7 shows the capacity loss until 2027 based on current time limited permissions. However, there is still sufficient capacity to maintain a supply of at least 1.0 million tonnes per annum until 2027.
Table 7: Recycling capacity (tonnes) lost based on current temporary permissions
| Site name | Expiry | Capacity loss | Cumulative remaining capacity |
|---|---|---|---|
| Runfold South | 2018 | - 50,000 | 1,551,000 |
| Addlestone Quarry | 2020 | - 100,000 | 1,451,000 |
| Hithermoor Quarry | 2022 | - 250,000 | 1,201,000 |
| Stanwell Quarry | 2027 | - 217,000 | 984,000 |
| Queen Mary Quarry | 2033 | - 200,000 | 784,000 |
| Homefield Sandpit | 2042 | - 24,000 | 760,000 |
Operator interest is currently being shown in extending the temporary permission at Hithermoor Quarry beyond 2022 linked to the extraction of sand and gravel at the Minerals Plan Preferred Area H (King George VI reservoir).
Imports through rail aggregate depots
In view of the relatively low quantity of land-won sand and gravel imports into Surrey, imports from the rest of the south east are likely to be able to continue for the foreseeable future. However, this relies upon capacity being available at rail aggregate depots within surrounding authorities' areas. This will continue to be explored in ongoing Duty to Cooperate discussions, the results of which will be reported on and will inform future LAAs.
The demand for land-won imports is not anticipated to increase in the short to medium term. This is due to:
- significant increases in recorded sales of recycled aggregates; and
- the improving position with regard to the landbank for sand and gravel.
However, in the next 10-20 years it may become increasingly difficult to maintain a 7 year landbank for sharp sand and gravel. An increase in the demand for imports can therefore be anticipated in the longer term. These may be imported from a wider catchment given that average haulage distances for aggregates have continued to grow, reaching 30 miles in 2016 (summary sustainable development data, sustainable development report, 2017).
Imports of marine aggregates
The marine sand and gravel landed at the South East wharves continues to be received from the East Coast, Thames, South Coast and East English Channel licensed dredging areas via existing rail depots. The Crown Estate advises that there are significant reserves available to the south east (South East England Aggregates Working Party aggregate monitoring report 2014-2015).
Imports of crushed rock
Surrey imported at least 450,000 tonnes in 2019 of which over 80% was imported from Somerset with the remainder primarily sourced from Leicestershire and Derbyshire (8%) and Glensanda Quarry, Scotland via the Isle of Grain (12%). A significant amount of crushed rock is imported directly into Surrey via the rail depot in Woking. The remainder is likely to have been transported to rail depots just beyond the county boundary such as at Purley and then transported the short distance into Surrey by road.
Relevant LAAs from the MPAs where crushed rock is sourced suggest there will be no supply issues in the foreseeable future:
- Somerset LAA indicates that the landbank for crushed rock at the end of 2015 was approximately 380 million tonnes or sufficient for 28 years.
- Gloucestershire LAA 2018 indicates a crushed rock landbank totalled 20.83 mt with the remaining length of this landbank standing at 14.58 years.
- The Derbyshire and Peak District LAA 2020 explains that there is an estimated reserve of rock for aggregate use of over 766 mt sufficient for over 60 years provision.
- The Leicestershire LAA 2018 reports estimated permitted reserves of crushed rock at the end of 2018 were around 376 million tonnes. This is sufficient permitted material to last about 30 years.
Rail depot infrastructure
Surrey has two rail aggregate depots at Woking and Salfords, both of which are safeguarded by the Surrey Minerals Plan Core Strategy Development Plan document. Between them they present a good geographic spread between the west and east of the county. Their rail connections enable the supply of crushed rock from the West Country or crushed rock and marine sand and gravel from wharves on the Thames Estuary.
The facility at Woking is the principal rail depot in the county. The depot receives rail-borne imports of crushed rock from Torr Quarry in Somerset (approximately 50% of total imports to the Woking depot) and sharp sand and gravel imports from Greenwich wharves (approximately 50% of total imports to the Woking depot).
In 2014, planning permission was granted at Salfords rail depot to develop a modern rail aggregate depot facility comprising the retention and relocation of the existing facility within the site. The site has been inactive for a number of years. The new facility would be able to import up to 100,000 tonnes per annum of aggregates from rail-borne imports. This is well in excess of the tonnages handled during the most recent years in which the facility has been active.
Estimates obtained from operators indicate that the proportion of aggregates imported from surrounding rail depots which are sold in Surrey comprise 40% from Purley, 30% from Crawley, 20% from Tolworth and 10% from Brentford. Imports from these facilities are estimated to be around 450,000 tonnes per annum. The proportion imported from Colnbrook is not known but is thought to be low. Annex 3 shows the location of rail aggregate depots located in Surrey and just beyond the county boundary.
The 2009 regional study, 'Aggregate Wharves and Rail Depots in South East England' estimated that rail aggregate depots in the South East had a capacity of 7.2 million tonnes. The 2009 report is the most up to date assessment of aggregate wharves and rail depots in the South East, although capacity is not expected to have changed significantly. Demand for imports of rail-borne aggregate was forecast to increase by 300,000 tonnes from 3.4 million tonnes in 2006 to 3.7 million tonnes in 2016, leaving a spare capacity of 3.5 million tonnes. The report concluded therefore that existing capacity was sufficient to handle the forecast growth in aggregate demand in 2016. The report also identified ten potential new sites, none of which were situated proximate to Surrey.
Assessment: demand versus supply
Land-won aggregate from sources within Surrey
The rolling average of the ten year average past sales figure is likely to remain below the minerals provision rate for the foreseeable future. Hence, the MPA has calculated an LAA rate of 0.9 million tonnes per annum to be more in line with anticipated sales. Adopting the new LAA rate yields an aggregate landbank of 7.8 years at the end of 2020.
Sharp sand and gravel
Although the landbank at the end of 2017 was just 3.6 years at the Surrey Minerals Plan minerals provision rate, under the new LAA rate the landbank is slightly more favourable at 3.8 years. Further to this, two planning applications on preferred areas identified in the Surrey Minerals Plan Primary Aggregates Development Plan Document are awaiting determination and commencement.
There are sufficient preferred areas identified in the Surrey Minerals Plan Primary Aggregates Development Plan Document to enable a 7 year landbank to be maintained in the short to medium term. Once these sites have come forward and been worked out, opportunities to identify further preferred areas suitable for mineral extraction are severely limited as the identified resource becomes increasingly depleted.
The land assessment work undertaken for the current plan indicated that available resources for concreting aggregates were becoming increasingly difficult to identify and that there were no viable alternatives within the county to those proposed for inclusion as preferred areas within the Surrey Minerals Plan. It was found that the most accessible sharp sand and gravel resources had already been exploited. Those that remained were more difficult to exploit because of their potential impact on local communities or the environment, because they were too small to be economically viable, or because land ownership issues prevented their working.
For this reason, the Surrey Minerals Plans recognises that the reserve position for land-won sharp sand and gravel could become critical over the latter part of the plan period. It states that "…identified potential reserves of concreting aggregates will be almost fully exploited before 2026 even under the low (production) scenarios"(Surrey Minerals Plan Primary Aggregates Development Plan Document, 2011). In relation to mineral resources generally, the Inspector's Report acknowledged that "unlike some other counties with substantial unconstrained mineral resources, Surrey is not in the position where there are sites being held in reserve"(Report on the examination into the Surrey Minerals Plan Core Strategy Development Plan Document, 2011). Hence, although production has been lower than anticipated it is likely that reserves will not be sufficient to maintain a 7 year landbank beyond 2026 and therefore increasing reliance will be placed on alternative sources of supply.
Soft sand
The resource position for soft sand is more favourable, as the 2020 landbank figure is 14.9 years. However, without additional sites coming forward the supply situation will inevitably become tighter towards the end of the plan period.
The Surrey Minerals Plan Core Strategy Development Plan Document includes a presumption against new workings of soft sand within the Area of Outstanding Natural Beauty which covers around 25% of the county. This is because it is not so scarce as to justify sufficient need (in the wider public interest), to outweigh the objectives to conserve the landscape and scenic beauty of the designation, which has the highest status of protection. This situation will need to be closely monitored.
Alternative supply options
Recycled and secondary aggregate
The production of recycled and secondary aggregates will go some way to providing an alternative, but will not eliminate the need for primary aggregates. Production in Surrey from fixed sites has increased from 0.25 million tonnes in 2007 to 1.23 million tonnes in 2019 (dropping to 0.6 million tonnes in 2020 due to the Covid-19 pandemic). In view of the importance of this alternative supply of aggregate it is considered appropriate to make provision for a capacity of at least 1.0 million tonnes per annum to be sustained.
Many of the recycling facilities are subject to temporary permissions but nevertheless sufficient capacity exists in the short to medium term. The Aggregates Recycling Joint Development Plan Document allocates / identifies specific site allocations for aggregates recycling and also includes a criteria based policy to guide proposals for development on non-allocated / identified sites. Aggregate recycling capacity will be reviewed as part of the Minerals Plan review that began in 2020.
Importing aggregates into Surrey
There is the potential for the Woking rail depot to be enhanced, and there are proposals to build a modern replacement facility at Salfords Depot. Both provide potential to increase imports of crushed rock, land-won sand and gravel, marine aggregates and recycled and secondary aggregates into the county by rail. The potential to import further aggregate material is further enhanced by the county's close proximity to existing rail aggregate depot facilities at Brentford, Colnbrook, Tolworth, Purley and Crawley. These facilities also serve Surrey, primarily with crushed rock and marine sand and gravel.
Conclusion
Surrey has an upwards sales trend for sand and gravel, with sales at the end of 2020 reported as 0.76 million tonnes. Sufficient reserves are identified in the Surrey Minerals Plan that with the new LAA rate of 0.9, Surrey will be able to maintain a 7 year land bank in the short to medium term, with the land bank at the end of 2020 being 8.7 years. The overall sales position is up slightly from 2019, but masks the contrast between the sharp sand and gravel and soft sand position.
At the end of 2020, soft sand sales were slightly down from the 2019 figure. The current supply situation is good, with a healthy 14.9 year land bank with the new LAA rate. However, much of Surrey's resource is focused in the east of the county and within the Surrey Hills Area of Outstanding Natural Beauty, restricting future supply options. Inevitably, soft sand supply is likely to become more limited towards the end of the plan period.
Recycled aggregate sales in 2019 decreased from 1.12 million tonnes to 0.6 million tonnes in 2020, therefore no longer exceeding the 2026 target of at least 0.9 million tonnes per annum of recycled aggregate specified in the Surrey Minerals Plan. This decrease is due to the impact of the Covid-19 pandemic.
Surrey has only one active rail depot in Woking, with a currently inactive depot at Salfords and several depots located just beyond the county boundary. Both Woking and Salfords depots are safeguarded within the Surrey Minerals Plan. As Surrey will increasingly continue to rely upon imports in the future, Surrey has been working with operators to establish the capacity of rail depots within and proximate to Surrey to ensure future aggregate supply can be maintained.
It is considered that recent permissions and current planning applications at preferred areas have the potential to significantly increase land won supply in future years, but alternative sources will continue to be important. The review of the new Surrey Minerals and Waste Local Plan commenced in 2020.
Annex 1: Sand and gravel reserve sites in Surrey 2020
The following lists set out the sites that contained permitted reserves on 31 December 2020 and contributed towards the landbank in Surrey.
Sharp sand and gravel reserve sites in Surrey (31 December 2020)
Active:
- Queen Mary Reservoir, Staines
- Homers Farm, Staines
Inactive:
- Addlestone Quarry, Addlestone
- Hithermoor Quarry, Stanwell Moor
- Manor Farm, Laleham
Soft sand reserve sites in Surrey (31 December 2020)
Active:
- Moorhouse Sandpits, Limpsfield
- North Park Quarry, Godstone
- Land North East of Pendell Farm, Bletchingley
- Mercers South Quarry, Nutfield
Inactive:
- Homefield Sandpit, Guilford Road, Runfold
- Alton Road Sandpit, Farnham
No new permissions were granted between 1 January 2020 and 31 December 2020.
Figure 2: Aggregate resources and active workings in 2020
Key:
- Active soft sand sites (building sand):

- Active sharp sand and gravel sites (concreting aggregate):

- Active soft sand sites (silica sand):

- Boundary of significant sand and gravel deposits:

- Sandgate and Hythe Beds:

- Folkstone beds:

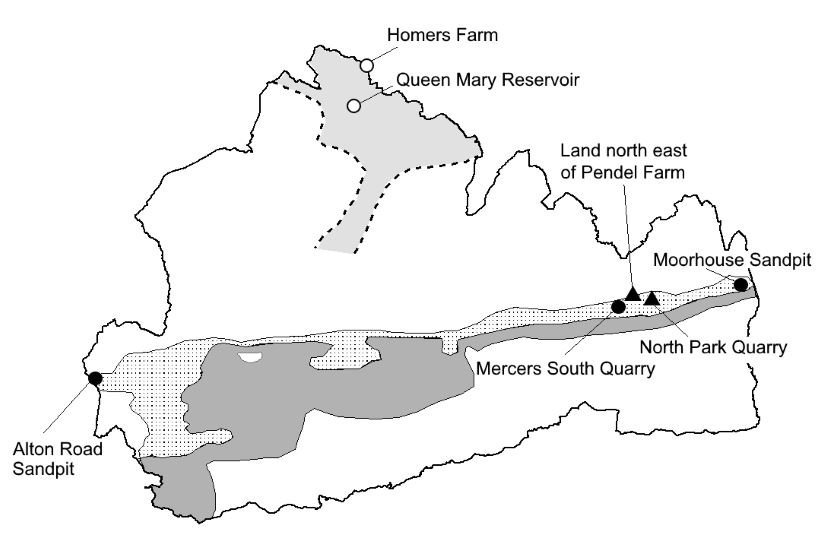
Annex 2: Aggregate recycling facilities in Surrey 2020
| Temporary sites | Capacity (tonnes per annum) |
|---|---|
| West of Queen Mary Reservoir | 200,000 |
| Stanwell Quarry | 164,500 |
| Hithermoor Quarry | 250,000 |
| Addlestone Quarry | 100,000 |
| Homefield Sandpit | 2127,500 |
| Moorhouse Sandpit | 25,000 |
| Total (all temporary sites) | 956,000 |
| Permanent sites | Capacity (tonnes per annum) |
|---|---|
| Sunnyside, Clasford Bridge | 62,500 |
| Capital House | 18,000 |
| Little Orchard Farm | 300,000 |
| Normans Corner | 33,000 |
| Perrylands | 42,500 |
| Reigate Road | 45,000 |
| Plough Industrial Estate | 46,000 |
| Kill Copse | 16,500 |
| Total (all permanent sites) | 563,500 |
Total aggregate recycling capacity in 2019 = 1,519,500 tonnes per annum.
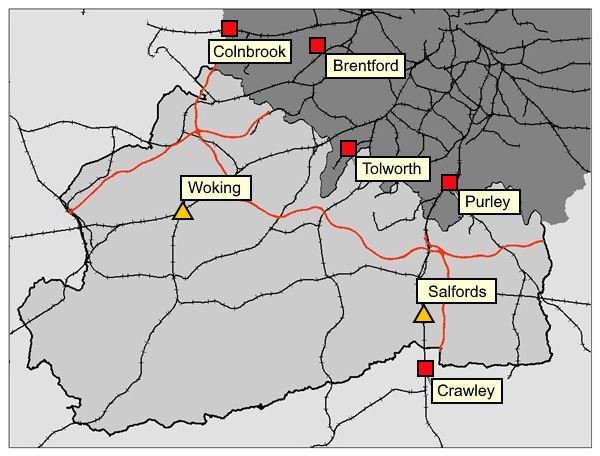
Annex 3: Rail aggregate depots within and close to Surrey 2020
The following list sets out the active and inactive rail aggregate depots in and within close proximity to Surrey in 2020 that are safeguarded by the Surrey Minerals Plan 2011 (Policy MC6).
Rail aggregate depots in Surrey:
- Woking Rail Aggregate Depot (Active)
- Salfords Rail Aggregate Depot (Inactive)
Rail aggregate depots within close proximity to Surrey:
- Tolworth Rail Aggregate Depot (Active)
- Purley Rail Aggregate Depot (Active)
- Crawley Rail Aggregate Depot (Active)
- Brentford Rail Aggregate Depot (Active)
- Colnbrook Rail Aggregate Depot (Active)
Figure 3: Location of rail aggregate depots in and around Surrey
Key:
- Motorway:

- Rail aggregate depot:

- Rail aggregate depot proximate to Surrey:

- Railway: